
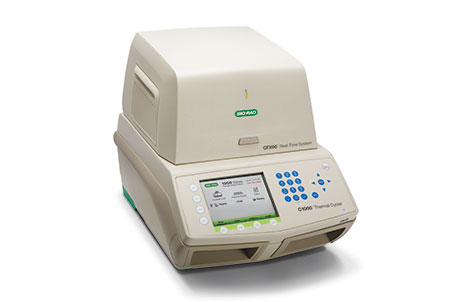
THERMAL CYCLER
- Fast run times
- PC viewer option
- Simple user interface
- No condensation after overnight cooling at 4° C
Effectively separates the 96-well plate into six 4 x 4 temperature regions and allows you to pick the temperatures you want to test against. These regions are easily identified by the blue and black squares visible on the microplate. Instead of having the thermal cycler choose temperatures for you, you can choose any temperature within a 24° C range It has a heating rate of 4° C/sec and a cooling rate of 3° C/sec. Minimized overshooting and undershooting ensure your reactions see only the temperatures they are supposed to see.
Additional features include 200 complete password-protected programs; 50 sets of program folders; temperature and time increments/decrements; and the PC viewer option, which allows temperature profiles to be viewed in real time.

GEL DOCUMENTATION SYSTEM
* Fast and easy-to-use basic gel documentation system for nucleic acid and protein gels
* Tray-based system for application driven image acquisition
* Small benchtop footprint
Image Acquisition
CCD camera-based system with four application-specific trays:UV tray for DNA and RNA gels and fluorescence stain imaging
White tray for Coomassie, copper, silver, and other EPI white light applications
Blue tray for low-intensity UV DNA/RNA detection (avoid "nicking" DNA)
Stain-free tray for in-gel protein detection

ELISA READERS
From basic ELISA to intracellular imaging and multi-mode microplate reading, we have units suited to a variety of workflows. Our microplate readers provide rapid and cost-effective data collection and sensitive, accurate analysis across a wide range of applications in the life sciences.
- Cell Imaging Multi-Mode Microplate Readers
- Hybrid Multi-Mode Microplate Readers
- Multi-Mode Microplate Readers
- Absorbance Microplate Readers
- Filter-based Absorbance Readers
- Fluorescence Microplate Readers

ELECTROPHORESIS SYSTEMS
- Protein gel electrophoresis is a simple way to separate proteins prior to downstream detection or analysis.
- High-quality protein electrophoresis products unites
- gels, gel tanks, protein gel handcast system, stains,
- molecular weight markers and standards, running buffers, and blotting products for your protein analysis experiments

CHROMATOGRAPHY SYSTEM &COLUMNS
Proven systems that are rugged and versatile, with the flexibility to customize
Meet the needs and requirements for your application by selecting from our extensive portfolio of Thermo Scientific UltiMate 3000 HPLC systems. With customizable configurations, these systems provide you with the flexibility to accomplish all applications from method development to routine analysis with HPLC to UHPLC capabilities.

ATOMIC ABSORPTION SPECTROPHOTOMETER
Atomic absorption spectroscopy (AAS) is used to analyze metal samples by determining the presence and concentration of metals in a liquid sample. Metals include Fe, Cu, Al, Pb, Ca, Zn, Cd and many more. It also measures the concentrations of metals in the samples. Typical concentrations range in the low mg/L range.
In their elemental form, metals will absorb ultraviolet light when they are excited by heat. Each metal has a characteristic wavelength that will be absorbed. The AAS instrument looks for a particular metal by focusing a beam of UV light at a specific wavelength through a flame and into a detector. The sample of interest is aspirated into the flame. If that metal is present in the sample, it will absorb some of the light, thus reducing its intensity. These instruments measure the change in intensity. A computer data system converts the change in intensity into an absorbance.

SONICATORS
High shear forces created by ultrasonic cavitation have the ability to break up particle agglomerates and result in smaller and more uniform particles sizes. The stable and homogenous suspensions produced by ultrasonics are widely used in many industries today. Probe sonication is highly effective for processing nanomaterials (carbon nanotubes, graphene, inks, metal oxides, etc.) and Sonicators have become the industry standard for:
- Dispersing
- Deagglomerating
- Particle size reduction
- Particle synthesis and precipitation
- Surface functionalization

FTIR Spectrophotometer
Fourier-transform infrared spectroscopy (FTIR) is a technique used to obtain an infrared spectrum of absorption or emission of a solid, liquid or gas. An FTIR spectrometer simultaneously collects high-spectral-resolution data over a wide spectral range. This confers a significant advantage over a dispersive spectrometer, which measures intensity over a narrow range of wavelengths at a time.
FTIR can be used in all applications where a dispersive spectrometer was used in the past. In addition, the improved sensitivity and speed have opened up new areas of application. Spectra can be measured in situations where very little energy reaches the detector and scan rates can exceed 50 spectra a second. Fourier transform infrared spectroscopy is used in geology, chemistry, materials and biology research fields.
Real Time PCR
(Real-time PCR) is commonly used to measure Gene Expression It is more sensitive than microarrays in detecting small changes in expression but requires more input RNA and is less adaptable to high-throughput studies, It is best suited for studies of small subsets of genes. Its one major shortcoming is that the sequence of the specific target gene of interest must be known (so you can design the PCR primers), hence real-time PCR can only be used for studying known genes.

Uv Vis Spectrophotometer
Ultraviolet-visible spectroscopy or ultraviolet-visible spectrophotometry (UV-Vis or UV/Vis) refers to absorption spectroscopy in the ultraviolet-visible spectral region. This means it uses light in the visible and adjacent (near-UV and near-infrared (NIR)) ranges. UV/Vis spectrophotometer is used in the quantitative determination of concentrations of the absorber in the solutions of transition metal ions and highly conjugated organic compounds.
UV/Vis spectroscopy can be used to determine the concentration of the absorber in a solution. The absorbance changes with concentration. This can be taken from references (tables of molar extinction coefficients), or more accurately, determined from a calibration curve.